MBA Chart of the Week: Builder Applications Survey Index

Source: MBA Builder Applications Survey.
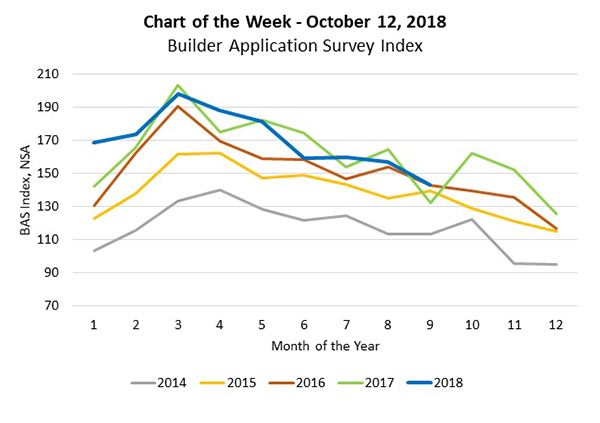
This week’s chart addresses the latest findings from MBA’s Builder Applications Survey Index. The BAS follows monthly mortgage applications taken by lenders affiliated with, or who work in cooperation with, home builders on the purchase of new single-family properties.
In this week’s chart we compare the index level for purchase applications by month for 2014 through September 2018, not adjusted for any seasonal effects. The typical seasonal pattern is that application activity for newly built homes ramps up in February and peaks around March and April before decreasing for the rest of the year.
The level of applications for new homes generally increased with each successive year from 2014, although this trend has receded in 2018, as the applications index dipped below the 2017 level for several months. However, in September, we saw applications increase 8.2 percent relative to a year ago.
Home building has been impacted by the tight labor market, making it difficult for builders to find workers and subcontractors. Additionally, other inputs costs were increasing, such as lumber prices, even before there was any discussion of tariffs. This has reduced supply and added upward pressure to prices.
Average loan size for applications for new homes has increased with each year, averaging $291,000 in 2013 versus $336,000 (year to date average in 2018), a 15 percent increase in size over six years.
(Anh Doan is senior financial analyst with the Mortgage Bankers Association. She can be reached at adoan@mba.org.)
