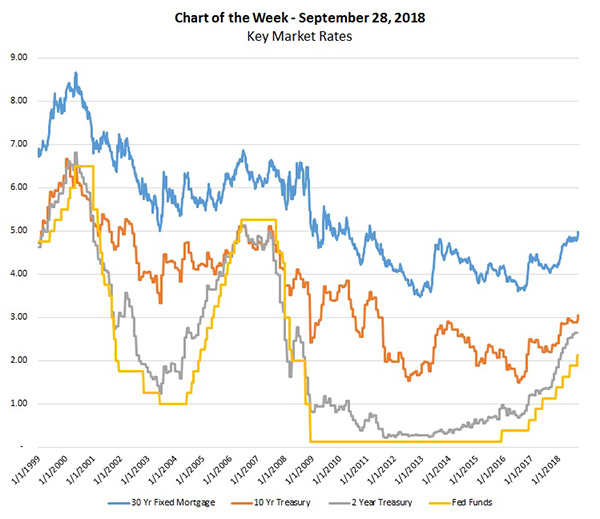
MBA Chart of the Week: Key Market Rates

Source: Federal Reserve, MBA.
This week’s chart features key market rates that impact the economy and housing markets.
As the economy continues to strengthen and as the job market powers ahead, the 10-year Treasury yield has increased by nearly 140 basis points since a recent low in 2016, averaging 2.9 percent for August and exceeding 3 percent in mid-September. Mortgage rates have followed suit and the average 30-year fixed rate was 4.8 percent in August and was 4.97 percent in the most recent week, the highest level since 2011.
The Fed has gradually tightened monetary policy over this period of growth, and as expected raised the fed funds rate to a range of 2.0 to 2.25 percent following the Sept. 25-26 Federal Open Market Committee meeting.
Congress sets two objectives for the Fed: to keep the job market strong and to keep prices stable, defined by the Fed as inflation close to 2 percent. The job market is incredibly strong, approaching 50-year lows for the unemployment rate, and inflation is now at or above the Fed’s inflation target.
At the same time, inflation-adjusted short-term rates are negative, indicating that policy is still stimulative. Therefore, it was not surprising that the Fed raised the federal funds target at this week’s meeting, and projected that short-term rates will continue to rise through 2019 and 2020. We expect long-term rates, including mortgage rates to increase, but nowhere near as fast as the increases in the federal funds rate.
The net impact of strong economic growth and only somewhat higher mortgage rates should remain a positive environment for the home purchase market, while continuing to winnow refinance demand.
(Michael Fratantoni is chief economist and senior vice president of research and economics with the Mortgage Bankers Association. He can be reached at mfratantoni@mba.org. Joel Kan is associate vice president of economic and industry forecasting with MBA; he can be reached at jkan@mba.org.)
