MBA Chart of the Week: Homeownership Rates by Age

Source: Census Bureau.
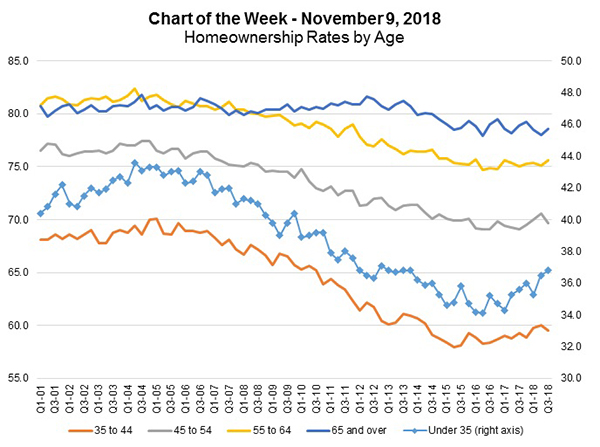
The focus of this week’s chart is the homeownership rate of the under-35 age group.
At 36.8 percent in the third quarter, this the highest homeownership rate for this group in five years. All age groups saw a steady decline in homeownership rates since the last recession and these rates have since leveled off and begun to show slow increases. However, the 35 and under group has seen its homeownership rate increase in five of the last six quarters, which is in line with a growing segment of the millennial generation hitting peak housing demand age.
In terms of the overall number of owner occupied households formed, we saw 1.5 million more households in the third quarter compared to a year ago, which puts us on pace for the strongest year since 2004.
Overall, the strong economy and these positive demographics should support strong housing demand for the next several years, even with higher mortgage rates and positive home price growth. We expect housing supply to increase slightly and wage growth to accelerate over the next two to three years, helping to bridge the gap between home price growth and income.
(Michael Fratantoni is chief economist and senior vice president of research and economics with the Mortgage Bankers Association. He can be reached at mfratantoni@mba.org. Joel Kan is associate vice president of economic and industry forecasts with MBA; he can be reached at jkan@mba.org.)
