MBA Chart of the Week: 10-Year Average Annual Change in Consumer Prices, Income

Source: Bureau of Labor Statistics.
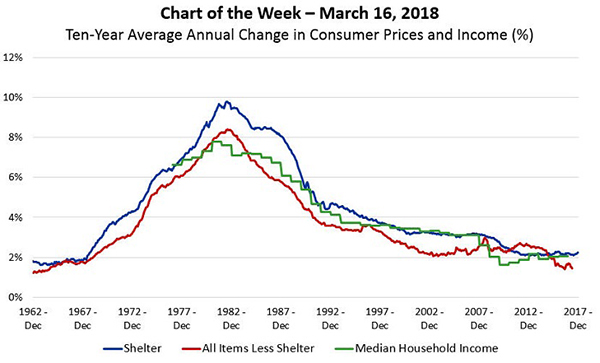
Over the long-term, housing costs tend to grow more quickly than either the prices of other consumer goods or typical household incomes.
The chart above shows how shelter (housing) costs, other consumer prices and median household incomes have changed over the prior 10 years, reported as an average annual rate of change. For example, the final points on the three lines show that over the previous 10 years (December 2007 and December 2017), housing costs rose at an average of 2.2 percent per year and prices of other consumer goods rose at an average of 1.3 percent per year. Median household incomes rose at an average of 2.0 percent per year between 2006 and 2016, the latest year for which data is available.
Except for in the shadow of the Great Recession, housing costs have always outpaced the prices of other consumer goods, and have generally outpaced median household incomes. The faster rate of growth of housing costs is attributable to a variety of factors. For example, over time more households have moved into urban and suburban areas, resulting in both a bidding up of land values and denser, more-expensive-to-build housing. Increased consumer demand for housing among some households and an inelasticity of demand among others have also played important parts.
Over the past 10 years, housing costs, other prices and incomes have all grown at extremely low rates because the 10-year averages are weighted down by the recessionary period. Over the long-term, it is likely we will continue to see shelter costs outpace both changes in the prices of other goods and of incomes.
(Jamie Woodwell is vice president of commercial/multifamily research and economics with the Mortgage Bankers Association. He can be reached at jwoodwell@mba.org.)
