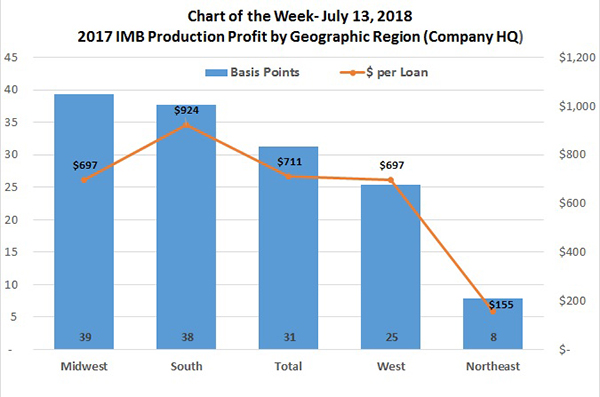
MBA Chart of the Week: 2017 Independent Mortgage Bank Profit by Geographic Region

Source: Mortgage Bankers Association.
The MBA Annual Performance Report released earlier this year contained 2017 data from nearly 250 independent mortgage banks and mortgage subsidiaries of chartered banks. This total sample of companies earned an average pre-tax production profit of 31 basis points on each loan they originated in 2017.
MBA Research recently conducted an analysis of the 2017 dataset that compares net production profit for firms headquartered in specific geographic regions of the country.
Companies headquartered in the Midwest and the South had the highest production profitability at 39 basis points and 38 basis points, respectively. Companies headquartered in the West and the Northeast had the lowest production profitability at 25 basis points and 8 basis points, respectively.
The results are also shown in dollars per loan to account for differences in average loan balances between regions. In the case of the Midwest region, for example, pre-tax production profits in dollars per-loan were closer to the total sample’s average because of lower loan balances compared to the other regions. Total revenues in basis points were highest in the Midwest and lowest in the Northeast, while total costs in dollars per loan were highest in the West and lowest in the Midwest.
Geographic regions are based on the following state assignments:
Midwest: IA, IL, IN, KS, MI, MN, MO, ND, NE, OH, SD, WI
South: AL, AR, DC, DE, FL, GA, KY, LA, MD, MS, NC, OK, SC, TN, TX, VA, WV
West: AK, AZ, CA, CO, HI, ID, MT, NM, NV, OR, UT, WA, WY
Northeast: CT, MA, ME, NH, NJ, NY, PA, RI, VT
(Marina Walsh is vice president of industry benchmarking and research with MBA; she can be reached at mwalsh@mba.org. Jenny Masoud is associate director of analytics with MBA; she can be reached at jmasoud@mba.org.)
