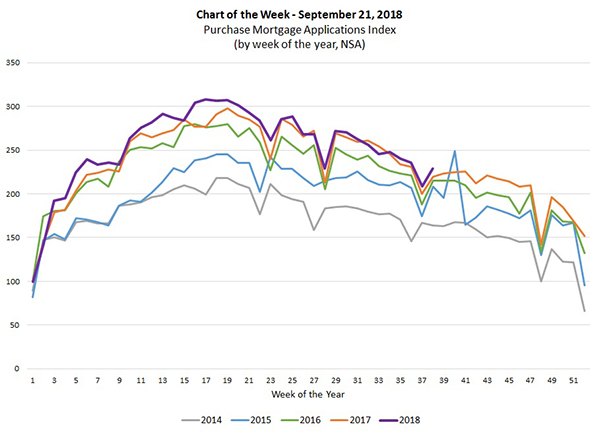
MBA Chart of the Week: Purchase Mortgage Applications Index

Source: MBA Weekly Applications Survey (https://www.mba.org/news-research-and-resources/research-and-economics/single-family-research/weekly-applications-survey/state-level-application-data).
This week’s chart shows how home purchase mortgage applications in recent weeks have started to increase again, compared to the same week a year ago, after weakening slightly in the late summer months.
We saw average year over year growth of around 4.5 percent from January to June, before the growth rate slowed to an average of 1.4 percent over July and August. Following that, the first two weeks of September have averaged 4.3 percent growth. We have also now seen five consecutive weeks of increases following two weeks of declines in early August.
As a large swath of the U.S. population approaches home buying age, and as older home owners potentially look to move or downsize, we expect housing demand to continue to increase. This has been supported by a strong economy and hot job market, as we have seen signs of more significant wage growth, especially for prime age workers.
Two main factors have held purchase activity back. First, there is a low inventory of homes for sale, impacted by slow growth in new housing starts and a low number of existing homes being listed for sale. Second, affordability challenges have emerged, caused by a combination of rapid home price growth (outpacing income growth) and increasing mortgage rates.
Even with these impediments to more rapid growth in the purchase market, we expect home purchase originations to increase by around 4 percent (based on dollar volume) in 2018 and in 2019.
(Joel Kan is associate vice president of economic and industry forecasting with MBA; he can be reached at jkan@mba.org.)
