MBA Chart of the Week: Actual and Tentative MBS Reinvestment Purchases

Source: Federal Reserve Bank of New York
Beginning this past October, the Federal Open Market Committee reduced its reinvestment of mortgage-backed securities principal payments by $4 billion a month, thereby allowing its nearly $2.5 trillion MBS portfolio to begin to slowly run-off.
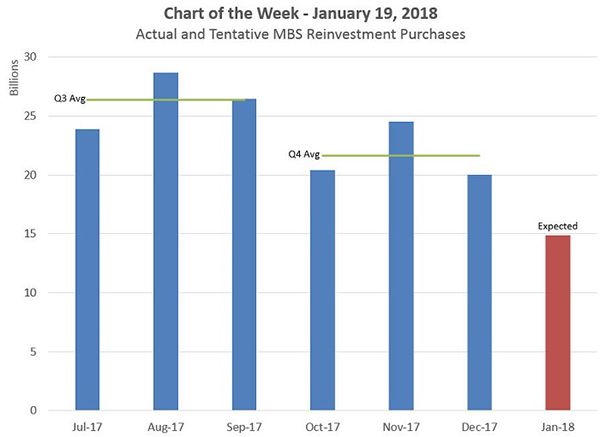
This week’s chart shows the MBS reinvestment activity of the Open Market Trading Desk at the New York Fed for the last half of 2017 and its expected activity in January. Although the total amount of principal returned to the Federal Reserve from its MBS holdings varies over time, the chart clearly shows a downshift in the amount of reinvestment undertaken by the Desk in the fourth quarter, from an average of $26.4 billion a month in Q3 to an average of $21.6 billion in Q4.
In each quarter of 2018 the Desk will allow the MBS portfolio to shrink a bit faster as the maximum monthly run-off will increase by $4 billion each quarter until reaching $20 billion a month in Q4 where the cap will remain on a go-forward basis. The first quarter increase in the cap to $8 billion can already be seen in the decline in expected January reinvestment activity compared to the three months prior.
Similarly, the Fed is allowing their holdings of Treasury securities to roll off at an increasing rate over time. With each increase in the run-off cap, the likelihood goes up that interest rates could rise and the spread between 10-year treasuries and mortgage interest rates could widen, as additional alternative investors must be attracted to these securities.
(Michael Fratantoni is chief economist and senior vice president of research and economics with the Mortgage Bankers Association. He can be reached at mfratantoni@mba.org. Lynn Fisher is vice president of research and economics with MBA; she can be reached at lfisher@mba.org. Joel Kan is associate vice president of economic forecasting with MBA; he can be reached at jkan@mba.org.)
