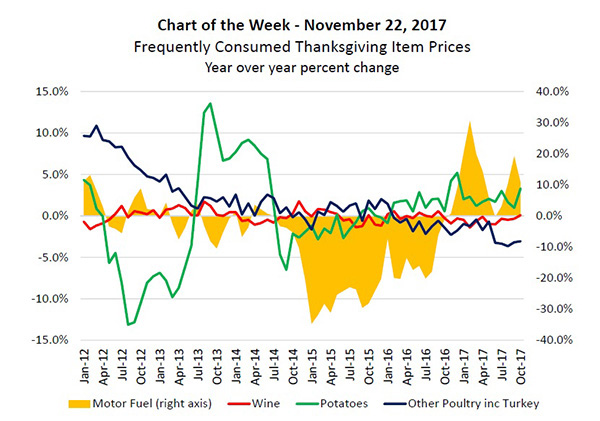
MBA Chart of the Week: Frequently Consumed Thanksgiving Item Prices

Source: Bureau of Labor Statistics.
Overall inflation as measured by the Consumer Price Index slowed slightly in October 2017, decelerating to a 2.0 percent year over year growth rate from 2.2 percent in September, according to the most recent data published by the Bureau of Labor Statistics.
However, core inflation, which excludes food and energy prices, increased to 1.8 percent from 1.7 percent in September, when compared to the same month a year ago. The divergence in the overall measure and the core measure was driven largely by a slowdown in energy prices. Motor fuel, which is a large portion of energy prices, slowed to a 10.8 percent growth rate compared to 19.2 percent the month before, as the impact of Hurricane Harvey on fuel prices continues to recede.
The slowdown in the growth rate in fuel prices will be welcome by those of us traveling over the holidays. In the spirit of Thanksgiving, our chart highlights the price trends of some commonly consumed food items such as wine, potatoes and turkey, since we often tend to ignore food prices in favor of a “core” measure of inflation. Volatility in potato prices have settled down over the last two years, while wine prices have held steady and the cost of poultry has been declining. Happy Thanksgiving, everyone!
(Lynn Fisher is vice president of research and economics with MBA; she can be reached at lfisher@mba.org. Joel Kan is associate vice president of economic forecasting with MBA; he can be reached at jkan@mba.org).
