MBA Chart of the Week: House Price Appreciation and Employment

Source: Federal Housing Finance Agency; Bureau of Labor Statistics
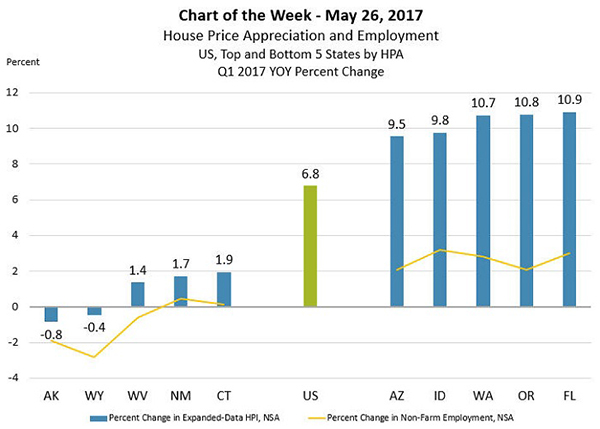
U.S. house prices increased by 6.8 percent in the first quarter relative to a year ago, according to the Federal Housing Finance Agency’s Expanded-Data House Price Index.
The price gain was supported by strong demand and low supplies of homes for sale, despite slowly rising interest rates.
Looking at the top and bottom five states ranked by first quarter house price appreciation, the year over year rate of change in non-farm employment is much lower in states experiencing weak or declining house prices as compared to places with much faster growth. The top five house price growth states are experiencing between 2 and 3 percent year over year growth in employment (U.S. employment overall grew by 1.6 percent in Q1).
Markets with the faster job growth tend to have faster home price growth. This is evidence against the presence of a house price “bubble” where prices grow in excess of fundamentals. The onus is now on cities, states and innovative homebuilders to find ways to build more homes in places where price growth is signaling for more development.
(Lynn Fisher is vice president of research and economics with MBA; she can be reached at lfisher@mba.org. Joel Kan associate vice president of economic forecasting with MBA; he can be reached at jkan@mba.org).
