MBA Chart of the Week: Existing Home Sales, Inventory & Months’ Supply

Source: National Association of Realtors.
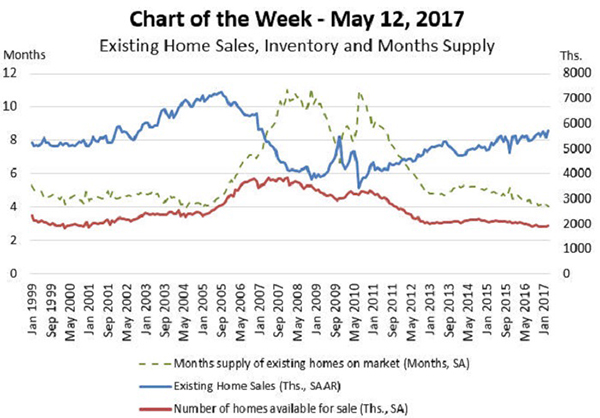
Relatively low inventories of homes for sale in the U.S. are putting upward pressure on house prices as demand continues to build on the strength of solid employment and favorable demographics.
Months’ supply is a measure frequently used to express the supply of existing homes for sale while accounting for the pace of homes actually sold. It is calculated as the end of month inventory for sale divided by seasonally adjusted existing home sales in the same month.
In this week’s chart, the rate of sales is shown at an annual rate (seasonally adjusted) and emphasizes that if the March pace of sales persists and inventory is not replenished, the current inventory will run out in well under a year, in just about four months. In recent months, home sales have been rising even as inventory is declining.
Prior to this past January, months’ supply has not been this low since January 2005, just prior to the peak of existing home sales, when the nature of demand and credit conditions were quite different. The average months’ supply over the history of the data has been about six months.
Below-average supply and increasing house prices in 2017 should elicit additional home building in the years ahead.
(Lynn Fisher is vice president of research and economics with MBA; she can be reached at lfisher@mba.org. Joel Kan associate vice president of economic forecasting with MBA; he can be reached at jkan@mba.org).
