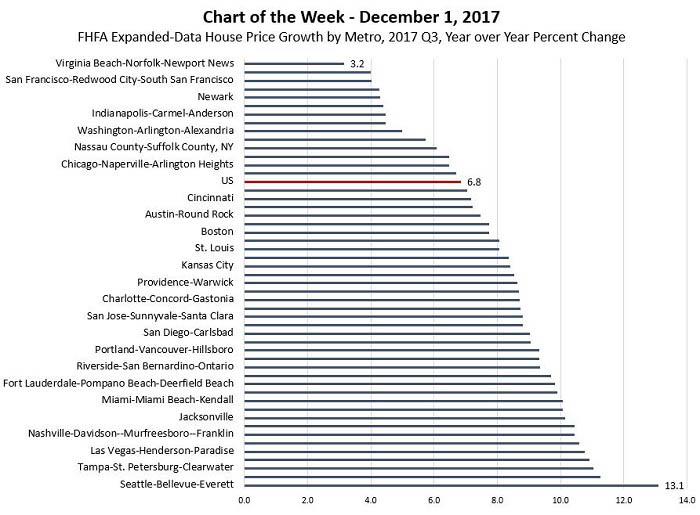
MBA Chart of the Week: FHFA Expanded-Data House Price Growth by Metro

Source: Federal Housing Finance Agency.
This past week, the Federal Housing Finance Agency released the Expanded-Data House Price Index for the third quarter.
The U.S. seasonally-adjusted index increased by 6.8 percent on a year over year basis, and FHFA announced the national conforming loan limit will be adjusted accordingly in 2018 to $453,100 from $424,100 in 2017. The ceiling on the limit for high cost areas will be set at 150 percent of the baseline limit, or $679,650. (https://www.fhfa.gov/Media/PublicAffairs/Pages/FHFA-Announces-Maximum-Conforming-Loan-Limits-for-2018.aspx)
This week’s chart displays year over year growth in house prices for the 50 largest metro areas from the same data. More than 70 percent of metros in this group experienced house price appreciation in the past year greater than the national average, suggesting house prices are growing a good bit faster in cities than for the country overall.
Seattle tops the list of year over year growth rates, coming in at greater than 13 percent, followed by Tampa, Las Vegas, Nashville and Jacksonville. Following years of fast-paced house price growth, San Francisco ranks 49th this year, as affordability problems have finally slowed growth to just 4 percent.
Some analysts are beginning to worry that home prices have raced ahead of incomes in a number of markets, and as happened in San Francisco, appreciation should start to slow in these markets over time.
(Lynn Fisher is vice president of research and economics with MBA; she can be reached at lfisher@mba.org. Joel Kan is associate vice president of industry surveys and forecasting with MBA; he can be reached at jkan@mba.org).
