MBA Chart of the Week: IMB Servicing

Source: MBA Quarterly Capital and Liquidity Profile for IMBs.
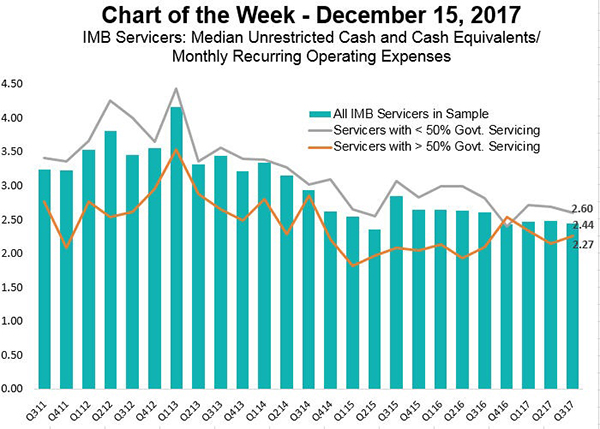
This week’s chart examines the operating liquidity of a sample of Independent Mortgage Bank Servicers.
We use Unrestricted Cash and Cash Equivalents divided by Monthly Recurring Operating Expenses to measure operating liquidity in terms of the number of months a mortgage company could meet recurring operating expenses (all operating expenses less commissions) without receiving any new income.
In the third quarter, the median number of months for the overall sample of 195 IMB servicers was 2.44 months, compared to a 3.12 months average for the six-year period from Q311 to Q317. Across almost all quarters, those servicers with more than 50 percent government servicing by count had a lower median number of months of operating liquidity than those servicers with less than 50 percent government servicing.
The Quarterly Capital and Liquidity Profile provides a snapshot of seven key metrics that assess the liquidity and capital adequacy positions of IMBs that own residential mortgage servicing rights. The CLP derives its data from those companies that submit the Quarterly Mortgage Bankers Financial Reporting Form to Fannie Mae, Freddie Mac and Ginnie Mae and release this data to MBA for use in aggregate industry statistics.
MBA members can access the latest CLP report by going to www.mba.org/researchformembers.
(Marina Walsh is vice president of industry benchmarking and research with MBA; she can be reached at mwalsh@mba.org. Jenny Masoud is research analyst with MBA; she can be reached at jmasoud@mba.org.)
