MBA Chart of the Week: Multifamily Lending By Banks; Net Change in Bank Multifamily Mortgage Holdings

Source: MBA; Federal Reserve.
One of the key puzzle pieces in sizing the multifamily lending market is assessing the level of multifamily lending taking place for bank balance sheets in real time.
Through MBA surveys and other sources, we get a good gauge of other parts of the market periodically during the year, but a thorough look at bank portfolio lending–which accounted for one of every three dollars of multifamily lending in 2016–comes only with the release of the Home Mortgage Disclosure Act data in October of the following year.
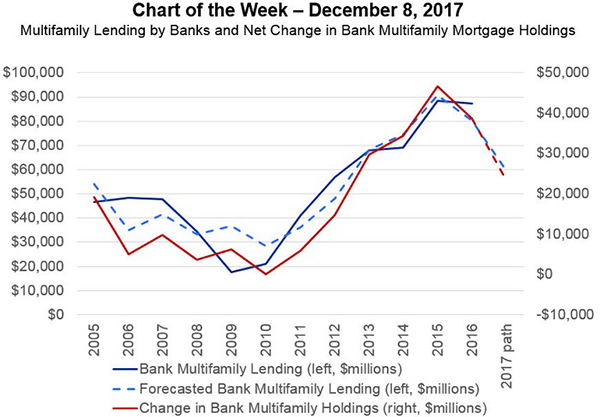
There are clues to the level of lending. The chart above shows the annual net change in bank multifamily mortgage holdings (in red) and (in solid blue) the level of multifamily lending for bank portfolios. While not perfect, changes in portfolios appear to give a strong hint of lending activity.
Based on data from the Federal Reserve Board’s H8 series, bank multifamily portfolios have grown by 6.4 percent through the end of November this year, after growing by more than 13 percent last year. Based on historical relationships, that would indicate a 2017 multifamily lending level of just less than $60 billion, compared to 2016’s $87 billion.
The projection isn’t destiny, but does give a first look at what we might expect when the actual numbers come in 10 months from now.
(Jamie Woodwell is vice president of commercial/multifamily research and economics with the Mortgage Bankers Association. He can be reached at jwoodwell@mba.org.)
