MBA Chart of the Week: Percent of FHA Purchase Loans by DTI
Source: GNMA
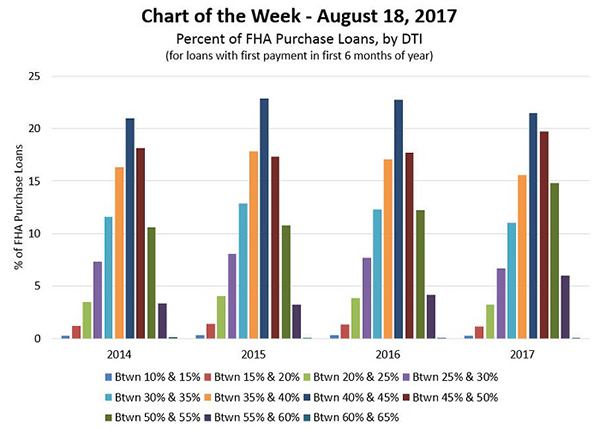
This week’s chart depicts the percentage of FHA purchase loans in GNMA securities according to their back-end debt-to-income ratios for loans with first payments during the first 6 months of 2017. The percentage of purchase loans with DTIs greater than 45 percent increased more than 9 percentage points over the last two years, from 31.4 percent in 2015 to 40.6 percent in 2017.
The largest two-year increase was in the DTI range of 50 to 55 percent (4 percentage points), followed by 55 to 60 percent (2.8 percentage points). Loans with DTIs greater than 50 percent represent 21 percent of FHA purchase loans in 2017.
We examined loans from the first six months of the year in order to provide an apples-to-apples comparison with the data available thus far in 2017 and to focus on the spring buying season. FHA limits the back-end DTI ratio, measured as all recurring monthly obligations divided by gross income, to 43 percent. Compensating factors may allow borrowers to exceed the limit, such as having a strong credit history or sufficient cash reserves, among other factors.
A trend toward higher DTIs may be the result of several factors including tight for-sale inventories that are pushing up home prices and stretching affordability, a greater willingness of lenders to underwrite to the full credit box provided by HUD, and a continuing shift in the composition of FHA borrowers.
–Lynn Fisher, lfisher@mba.org, Joel Kan jkan@mba.org