MBA Chart of the Week: Condo & Co-op Sales, Median Sales Prices

Source: National Association of Realtors
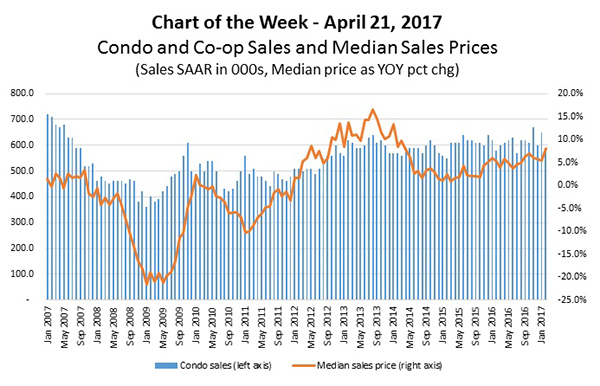
This week’s chart tracks sales for previously owned condominiums and co-ops, as well as their median sales prices over time.
Since hitting a historical low of 360,000 units in 2009, sales of condos and co-ops have seen some recovery, averaging a seasonally adjusted annual pace of around 560,000 units between 2010 and early 2017. However, between 1999 and 2008, the average was a little over 690,000 units, and the high point in the series was 932,000 units sold in June 2005.
The median sales price of condos and co-ops has increased recently, with the 8.1 percent annual change in February 2017 being the strongest month observed since early 2014.
As Millennials come of age and as the inventory of lower priced homes remains tight, condominiums may prove to be a natural source of homeownership opportunities. Increasing demand for ownership may encourage developers to shift towards condo products as the multifamily rental development cycle continues to mature.
Underwriting and risk management for mortgage lending on individual condo units is complicated by the fact that the evaluation of collateral includes not only the unit but also common aspects of a project that are jointly owned, governed and maintained by all unit owners.
MBA’s recent Condo Lending Workshop explored specialized underwriting and risk management associated with warrantable and non-warrantable condo projects, including nuanced insurance issues, data requirements and challenges of lending on newly developed condo projects.
(Lynn Fisher is vice president of research and economics with MBA; she can be reached at lfisher@mba.org. Joel Kan associate vice president of economic forecasting with MBA; he can be reached at jkan@mba.org).
