
In February 2026, with job losses in health care due to labor strikes, there was nothing left to support aggregate job growth, and total nonfarm payrolls declined by 92,000. Furthermore, job growth for December and January was revised down by a total of 69,000. Wage growth increased slightly to 3.8% over the past year.
Tag: Joel Kan

MBA Economist Weighs In on Q4 GDP Results
Real gross domestic product increased 1.4% in Q4 2025, the U.S. Bureau of Economic Analysis reported Feb. 20.
Jobs Up by 73,000 in July Amid May, June Revisions; Industry Economists Weigh In
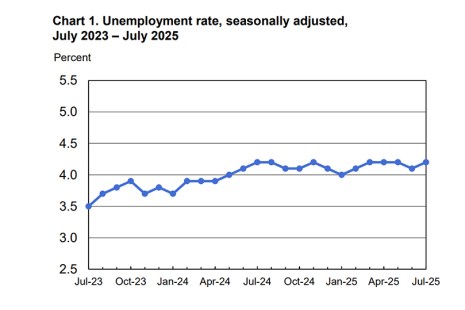
Total nonfarm payroll employment increased by 73,000 in July and the unemployment rate stood at 4.2%, the U.S. Bureau of Labor Statistics reported Aug. 1.
Jobs Report: U.S. Economy Adds 175,000 in April
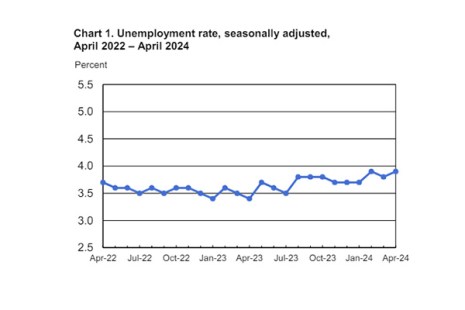
Total nonfarm payroll employment increased by 175,000 in April, per the Bureau of Labor Statistics.

Economic Outlook: ‘Some Momentum’ Going into 2024–#MBAServicing24
ORLANDO–The U.S. economy was stronger in 2023 than most analysts expected, according to Joel Kan, Vice President and Deputy Chief Economist with the Mortgage Bankers Association.