
The elevated cost burden of purchasing a new home since interest rates rose precipitously in 2022, has continued through mid-2025.
Tag: Edward Seiler
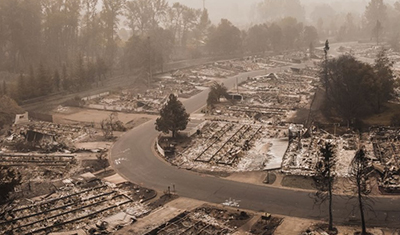
RIHA Releases Collection of Essays on Impact of Climate Change on Real Estate Finance
The Mortgage Bankers Association’s Research Institute for Housing America published a new collection of essays addressing the impacts of climate change on the real estate finance industry.
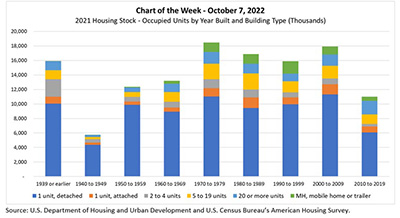
MBA Chart of the Week Oct. 13, 2022: 2021 Housing Stock
At the end of September, HUD and the Census Bureau released 2021 American Housing Survey summary table estimates in the AHS Table Creator and 2021 AHS National and Metro Public Use File microdata. The AHS, last updated with 2019 data, is the “most comprehensive national housing survey in the United States,” and provides information about the quality and cost of housing, including data on “the physical condition of homes and neighborhoods, the costs of financing and maintaining homes, and the characteristics of people who live in these homes.”
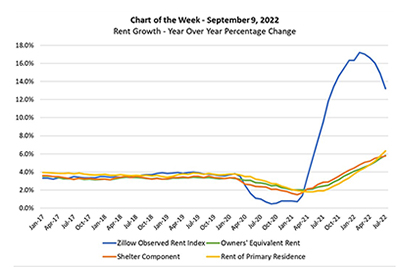
MBA Chart of the Week: Rent Growth–Year-over-Year Percentage Change
This week’s MBA Chart of the Week highlights a question related to housing costs and inflation: If home price appreciation and rent growth have been in double digits in the past few quarters—as highlighted by the (blue lined) Zillow Observed Rent Index in the chart—why is the shelter component (orange line) of the Consumer Price Index below 6%?
Who Owns Climate Risk? MBA White Paper Examines Challenges, Risks for U.S. Real Estate
The Mortgage Bankers Association this week issued a white paper examining how climate change is dramatically reshaping lenders’ and policymakers’ approaches to the U.S. real estate market.
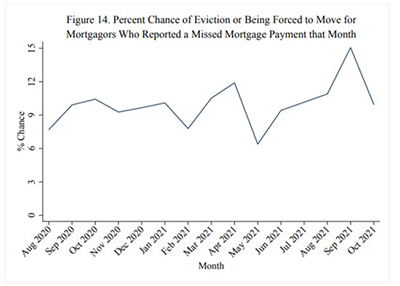
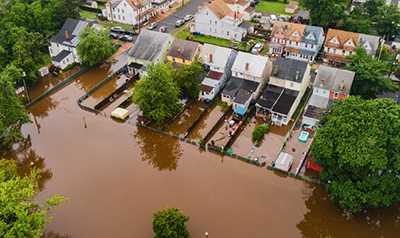
RIHA: More Renters, Fewer Homeowners Missed Housing Payments in September, October
Renters were three times more likely than homeowners to miss payments during September and October, according to updated research released Tuesday by the Mortgage Bankers Association’s Research Institute for Housing America.
MBA RIHA: Fewer Households Missed Housing Payments in Second Quarter
Slightly under five million households did not make their rent or mortgage payments in the second quarter, updated research from the Mortgage Bankers Association’s Research Institute for Housing America reported.
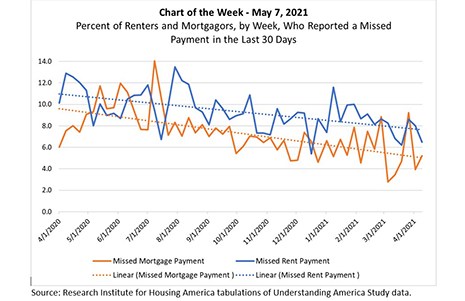
MBA Chart of the Week: Renters/Mortgagors & Missed Payments
The Research Institute for Housing America, MBA’s think tank, released updated first-quarter results that allow us to assess how renters, mortgagors and student loan borrowers fared over the first 12 months of the COVID-19 pandemic.
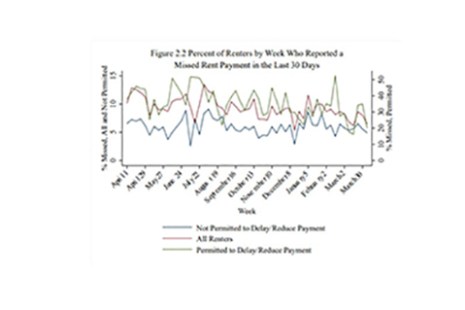
RIHA: Less Than 10% of Renters Have Missed Multiple Payments During Pandemic
Slightly under five million households did not make their rent or mortgage payments in March, an improvement from December 2020 and the lowest number since the onset of the COVID-19 pandemic, new research from the Mortgage Bankers Association’s Research Institute for Housing America reported.
MBA RIHA Study: Affordability Growing Challenge for Low-, Moderate-Income Renters in Majority of Top 50 Metros
Home prices and rent appreciation have exceeded income growth since the turn of the 21st century. This has created economic obstacles for many American households, especially for low- and moderate-income renters living in cities with recent employment growth but significant housing supply constraints.