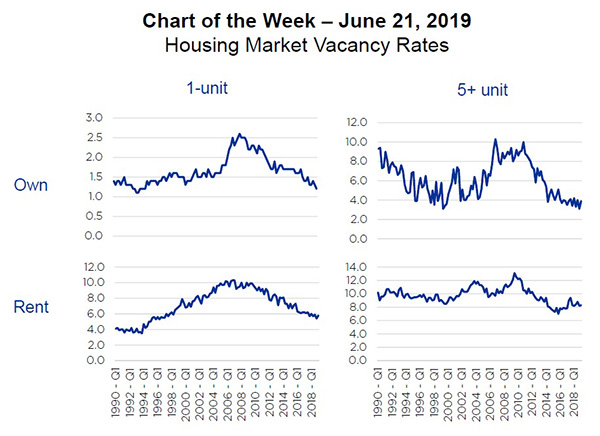
MBA Chart of the Week: Housing Market Vacancy Rates

Source: U.S. Census Bureau.
There has been a great deal of attention paid lately to the mismatch between the supply of, and demand for, housing in the United States. According to Census statistics, the U.S. added 1.5 million households during 2018 but built fewer than 1.2 million new housing units. The result is a tightening inventory–not just of homes for sale, but of homes available to occupy.
In the first quarter of this year, the vacancy rate for single-family owner-occupied homes fell to 1.2 percent–the lowest it has been since the middle of 1995. To give an indication of how quickly tides can turn, not even three years ago, at the end of 2016, the vacancy rate stood at 1.7 percent–a level that had only been touched twice prior to the Global Financial Crisis that took place more than a decade ago.
The multifamily rental market is further along in the supply/demand cycle (and also accustomed to higher overall vacancy rates). After little new construction took place during, and immediately after the crisis, strong demand from millennial and other households helped push the multifamily rental vacancy rate down to 7.0 percent at the end of 2015–the lowest level since the mid-1980s. The tight market promoted new construction and a steady rate of roughly 600,000 multifamily units under construction each quarter since July 2016. The new supply has begun to lift the vacancy rate, which hit 8.3 percent last quarter–higher, but still lower than at any time between 1986 and 2014.
New construction has helped bring some balance to the multifamily rental market, but–in the aggregate–it remains tighter than usual. At the same time, the mismatch between strong demand and relatively weak new supply has wrung all slack out of the single-family ownership market. Increased new construction is the only remedy.
(Jamie Woodwell is vice president of commercial/multifamily research and economics with the Mortgage Bankers Association. He can be reached at jwoodwell@mba.org.)
