MBA Chart of the Week: CMBS Annual Issuance Volume

Source: JP Morgan; CMAlert.
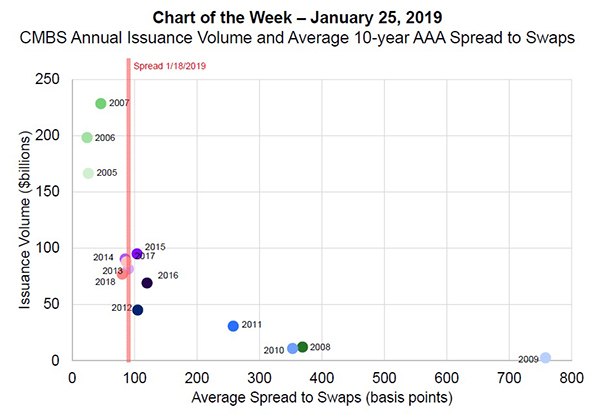
Issuance of commercial mortgage-backed securities dropped by 12 percent in 2018, to $77 billion.
Investor demand is a key driver of issuance volumes. When strong competition leads to tighter spreads, CMBS issuance tends to rise, sometimes dramatically. When demand slackens and spreads widen, issuance tends to fall. The spread between new-issue 10-year senior AAA bonds and swap rates averaged 80 basis points during 2018–starting the year at 74 basis points and ending at 106 basis points. Spreads have since tightened, falling to 94 basis points as of January 18.
Investor demand isn’t the only factor affecting CMBS issuance. In 2019, conduit deals, in which many loans are pooled together to back the securities, accounted for just 53 percent of total dollar volume. For comparison purposes, conduit deals accounted for 97 percent of volume in 2006 and 71 percent in 2016. Single-asset, single-borrower deals, in which one loan or borrower backs the loans, grew to 47 percent of total issuance in 2019, compared to 3 percent in 2006 and 29 percent in 2016.
Even with the slowdown in issuance, CMBS originations are once again outpacing loan payoffs and paydowns, leading to growth in overall CMBS mortgage debt outstanding. At the end of the third quarter 2018, there was $458 billion of loans in CMBS–$30 billion or 7 percent more than there had been in the second quarter of 2017 (the post-recession low).
If history is a guide, how spreads play-out this year will have a significant impact on CMBS issuance. Given current levels, it is likely this year’s originations and issuance will lead to a net increase in the outstanding balance of CMBS loans and bonds.
(Jamie Woodwell is vice president of commercial/multifamily research and economics with the Mortgage Bankers Association. He can be reached at jwoodwell@mba.org. Reggie Booker is associate director of commercial/multifamily research with MBA; he can be reached at rbooker@mba.org.)
