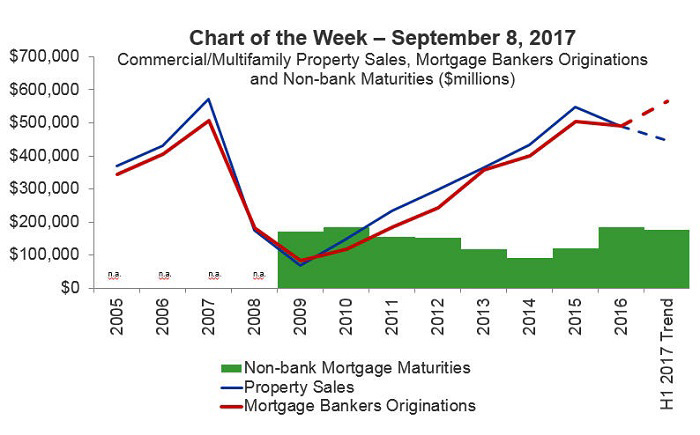
MBA Chart of the Week: Commercial/Multifamily Property Sales, Mortgage Bankers Originations and Non-Bank Maturities ($ Millions)

Source: MBA CREF Database and Real Capital Analytics.
Traditionally, commercial/multifamily mortgage bankers originations have tracked very closely with property sales volumes, with 2016 recording $490 billion of originations and $496 billion of property sales. That relationship broke down in the first half of 2017.
Through the first six months of 2017, Real Capital Analytics tracked $214 billion in commercial property sales–7 percent lower than during the same period in 2016–while MBA’s mortgage bankers origination index showed originations 15 percent higher than during the same period of 2016.
Some have looked to mortgage maturities to explain recent (and future) originations trends since more near-term maturities might induce more refinancing, but MBA’s data on maturities (green area) does not seem to support this theory. There could also be differences in the two series that contribute to their drift.
RCA’s numbers track property sales transactions of $2.5 million or greater, while MBA’s originations index tends to be more influenced by Fannie Mae and Freddie Mac multifamily loans (which are having another record year) and less influenced by retail bank loans (which we know from other sources have been slowing through the first half of the year.)
Whatever the cause, the long history of over-lap of the two series likely recommends they will come back in sync before too long. Whether originations fall, property sales pick-up, or the two series meet in the middle could be a $100 billion question.
(Jamie Woodwell is vice president of commercial/multifamily research and economics with the Mortgage Bankers Association. He can be reached at jwoodwell@mba.org.)
