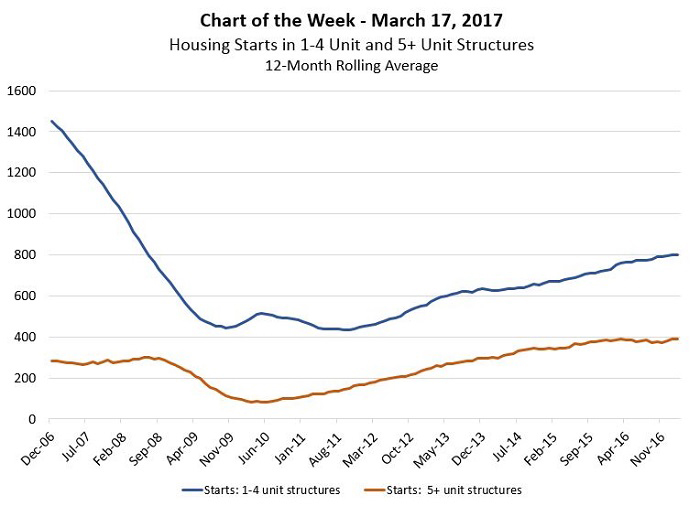
MBA Chart of the Week: Housing Starts in 1-4 Unit, 5+ Unit Structures

Source: Bureau of the Census
One-to-four family housing starts increased in February to their highest rate since October 2007, staying above 800,000 units for the fifth month in a row.
While that is a recent high, single-family starts still remain quite low relative to the historic average of more than a million units a year. Multifamily starts were essentially flat from January, coming in at 391,000 starts at a seasonally adjusted rate for February and above the long run average of 361,000 units.
This week’s chart shows a 12-month rolling average for housing starts so that we can better see the recent trends. Single-family starts are picking up steam whereas multifamily starts have remained fairly flat, just below 400,000 starts since fourth quarter 2015.
An alternative metric, units under construction, suggests that more resources have been flowing to multifamily housing compared to one-to -our family housing since 2013. In February, nearly 1.1 million total units were under construction in the U.S., comprising 626,000 multifamily units (highest point since 1974) and 465,000 one-to-four family units (below average).
Together, these statistics show that new construction of one-to-four family houses is still early in its cycle, whereas the multifamily cycle is at a more mature stage.
(Lynn Fisher is vice president of research and economics with MBA; she can be reached at lfisher@mba.org. Joel Kan associate vice president of economic forecasting with MBA; he can be reached at jkan@mba.org.)
