Chart of the Week: Selected Indexes of Housing Costs
Sources: MBA, Zillow, U.S. Census Bureau, U.S. Bureau of Economic Analysis, Bureau of Labor Statistics.
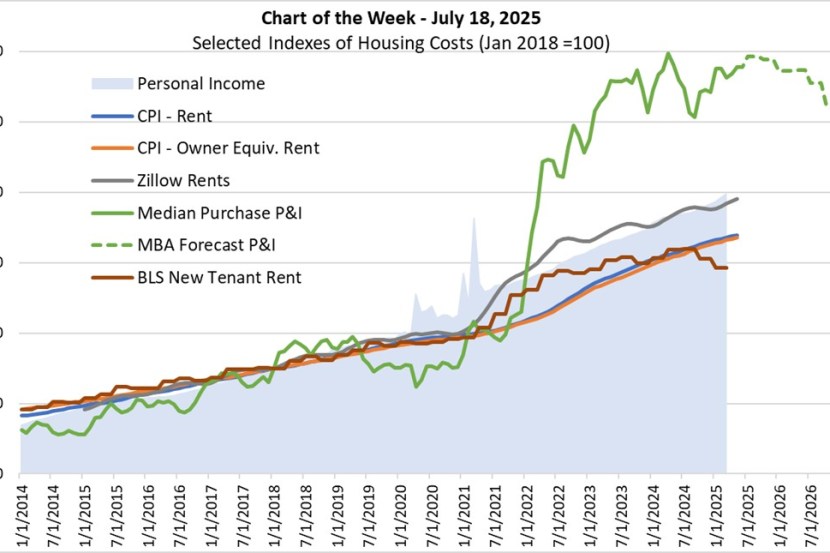
The elevated cost burden of purchasing a new home since interest rates rose precipitously in 2022, has continued through mid-2025. For example, the median principal and interest payment for purchase loans (P&I), based on MBA’s Weekly Applications Survey data, was 86% higher in May 2025 than in January 2018 (green solid line in this week’s chart), and even when we take rising incomes into account, as in MBA’s Purchase Applications Payment Index (PAPI), it was 35% higher.
Before the pandemic, various gauges of rental housing costs moved in unison more or less. These included asking rents as depicted by Zillow (gray line), the Bureau of Labor Statistics’ new tenant rent measure (brown line), and in-place rents, such as those followed by the consumer price index for rents (blue line) and for owners’ equivalent rents (orange line). Mortgage P&I (the more volatile green line) grew at a faster rate from 2014 through the start of 2019, but its growth reversed in the second half of 2019 as interest rates started to fall. Interestingly, all the indices grew at approximately the same average rate as personal income (light blue shaded area in the chart) over the pre-Covid period depicted in the chart.
The divergence of these measures during and following the pandemic raises the question of whether we should expect these housing cost measures to re-align. In particular, the nominal P&I index, which has eclipsed all the other measures shown since 2022, while volatile, has remained within the 170-190 range on the chart since early 2023, whilst the other measures have continued to grow.
To gauge forward, we use MBA’s June 2025 forecasts of interest rates and the median price of existing home sales to plot the green dashed P&I line. As forecasted interest rates fall to 6.4% and forecasted median prices fall below $400,000 in the fourth quarter of 2026, we predict that the P&I index will decrease by more than ten index points over the next 18 months, albeit remaining at relatively high levels.
MBA is also forecasting that house price appreciation will continue to moderate in the coming quarters. We predict that price growth will remain positive nationally but come down to 0.3% in the fourth quarter of 2026. In other words, we forecast that real house prices will decrease over the next year and a half, helping alleviate some of the affordability burdens on home purchasers.
-Edward Seiler