Chart of the Week: Annual Cost of Servicing Performing and Non-Performing Loans
(Source: MBA’s Servicing Operations Study and Forum; www.mba.org/sosf)
MBA’s annual Servicing Operations Study and Forum includes a deep-dive analysis and discussion of servicing costs, productivity, and portfolio characteristics for in‐house single-family servicers, representing about 60 percent of the single-family servicing market. Based on the most recent completed study cycle, fully-loaded servicing costs remained flat relative to the previous year at an average of $237 per loan. But that only tells part of the story.
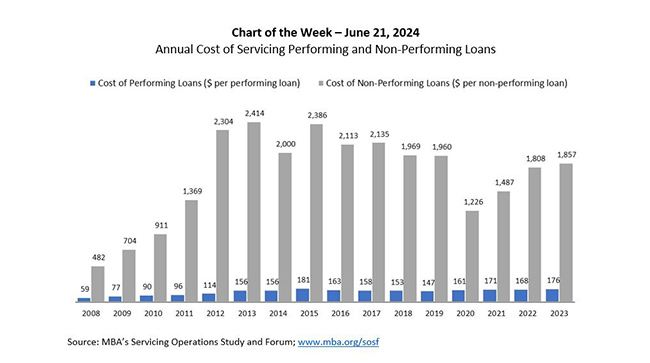
In the Chart of the Week, servicing operating costs are divided between performing and non-performing loans. Servicing costs for performing loans increased to $176 per loan in 2023 from $168 per loan in 2022. Certain functional areas of servicing reported gross cost increases, including statements and billings, systems, quality assurance, record retention and corporate compliance and risk management.
Likewise, servicing costs for non-performing loans increased. The average cost of servicing a non-performing loan was $1,857 in 2023, up from $1,808 per loan in 2022. Even though gross default-related costs dropped in 2023, the cost increase for non-performing loans can be attributed to default costs divided by fewer non-performing loans, and the general increase in non-default base costs spread across all loans, whether performing or non-performing. Note that the cost of non-performing loans grew for the third consecutive year in 2023. In 2020, at the height of the pandemic, mortgage forbearance put a pause on loan workout activity and foreclosure activity. At the same time, the number of non-performing loans grew. The decrease in default costs combined with the higher number of non-performing loans resulted in the lowest cost per non-performing loan recorded since 2010.
While the overall servicing costs per loan stayed flat year-over year in 2023, the costs of performing and non-performing loans increased. The changing servicing portfolio composition between performing loans versus non-performing loans, along with increases in non-default base costs to service, explain this difference.
Definitional Notes:
The costs associated with servicing performing loans include the base direct costs to service any loan, regardless of default status: call center, technology, escrow, cashiering, investor reporting, and executive management, among others. In addition, corporate overhead costs are included.
The costs of servicing non-performing loans include the same base direct costs and corporate overhead, as well as the following additional costs: collections, loss mitigation, bankruptcy, foreclosure and post-sale, unreimbursed foreclosure and real estate owned (REO) losses, and other default-specific costs.
Non-performing loans include loans 30 or more days delinquent and loans in foreclosure or in REO status prior to investor conveyance. For study purposes, MBA treats loans that missed mortgage payments but were in forbearance as non-performing.
Marina Walsh, CMB (mwalsh@mba.org)